Analytics and KPIs for WhatsApp sales: what to measure and how to optimize
Discover the key metrics to measure the success of your WhatsApp sales. Complete guide to KPIs, analysis tools and data-driven optimization strategies.
WhatsApp sales analytics is critical to understanding what strategies work, identifying opportunities for improvement, and continually optimizing your sales process. Without clear metrics and systematic analysis, it is impossible to determine the ROI of your efforts or make informed decisions about where to focus resources to maximize results.
SMBs that implement effective measurement systems for their WhatsApp sales report 35-50% improvements in conversion rates and 25-40% increases in average order value within the first six months. These results are due to the ability to identify and replicate successful strategies while eliminating tactics that do not generate results.
This guide will provide you with a complete framework to measure, analyze, and optimize your WhatsApp sales performance, from basic metrics to advanced analytics that drive sustainable growth for your business.
Key metrics for WhatsApp sales
Key metrics provide a clear view of the performance of your WhatsApp sales strategy and should be monitored consistently to identify trends and optimization opportunities.
Engagement and response metrics
The initial response rate measures what percentage of people you contact respond to your first message. A healthy rate ranges from 60-80% for WhatsApp Business, significantly higher than other channels such as email or phone calls. Rates below 50% may indicate problems with your initial approach or audience targeting.
Average response time is critical on WhatsApp, where customers expect immediate responses. You should aim to respond within 15 minutes during business hours. Times longer than 2 hours can result in significant lost opportunities, as customers may look for alternatives.
The average conversation length indicates the level of engagement of your customers. Very short conversations may suggest lack of interest or problems in your approach, while excessively long conversations may indicate inefficient processes or lack of clarity in your value proposition.
Conversion and sales metrics
Inquiry-to-sale conversion rate is the most critical metric, measuring what percentage of people who initiate a conversation eventually make a purchase. Successful SMBs typically achieve rates between 15-30%, depending on the type of product, price, and sales process implemented.
Average order value (AOV) allows you to understand the economic value of each customer and identify opportunities to increase the average ticket. Track this metric monthly to evaluate the impact of upselling, cross-selling strategies, or changes in your product mix.
Average sales cycle time measures how long it takes from first contact to close. This metric helps you plan your pipeline and identify bottlenecks. Longer cycles are not necessarily negative if they result in higher order value or customer satisfaction.
Retention and loyalty metrics
Recurring customer rate measures what percentage of customers make additional purchases after their first transaction. This metric is crucial for assessing customer satisfaction and the long-term growth potential of your business.
Customer lifetime value (LTV) calculates the total value a customer brings throughout their relationship with your company. This metric helps you determine how much you can invest in customer acquisition and which segments are most valuable to your business.
Average purchase frequency indicates how often customers return to purchase. This information is valuable for planning reactivation campaigns and developing effective loyalty programs.
Measuring tools and systems
To implement an effective analytics system, you need tools that capture, process, and present data in a way that facilitates informed decision making. The choice of appropriate tools can determine the quality and usefulness of your insights.
WhatsApp Business Analytics native
WhatsApp Business provides basic statistics including number of messages sent and received, messages read, and basic information about your company profile. Although limited, these metrics provide a useful baseline to begin your analysis.
Native statistics are especially useful for understanding basic communication patterns, identifying peak times, and monitoring the overall growth of your contact base. However, for deeper analysis you will need additional tools.
Integrated CRM systems
Specialized CRM systems such as Aurora Inbox provide significantly more advanced analytical capabilities, including full customer journey tracking, sentiment analysis, behavioral pattern identification, and customizable reporting.
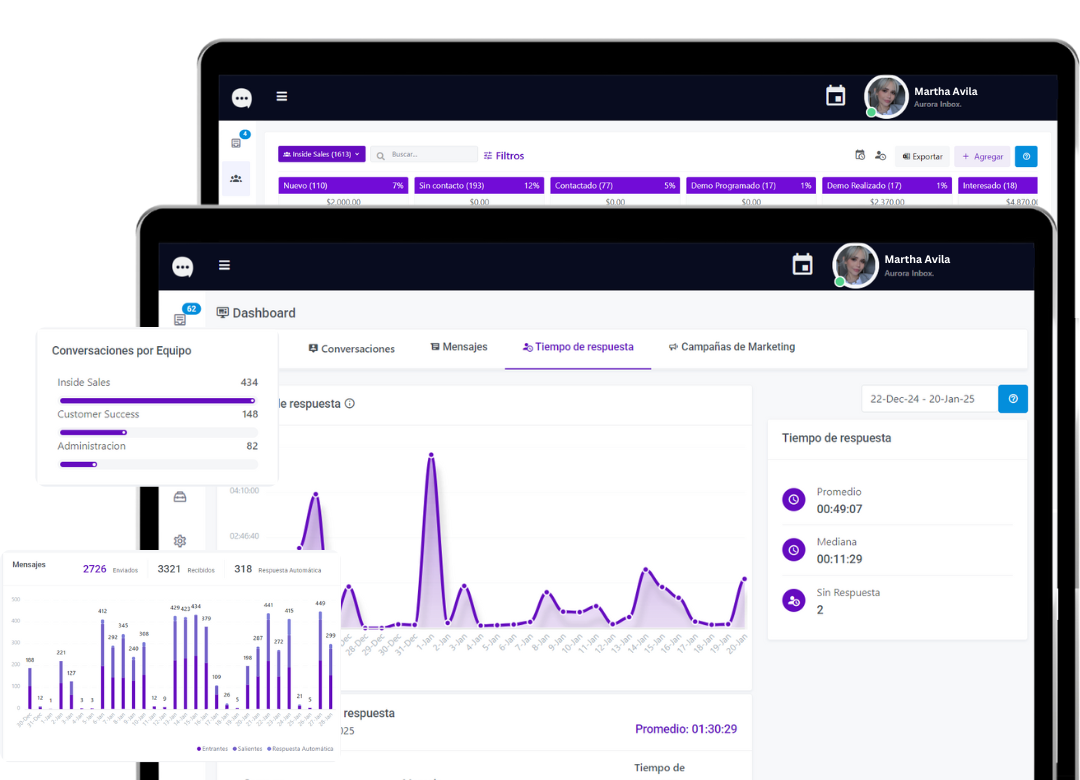
Aurora Inbox automatically tracks all important metrics and provides intuitive dashboards that facilitate data interpretation. The system can also automatically identify trends, alert on significant changes in performance, and suggest specific actions for optimization.
Integration with enterprise tools
To get a complete view of your performance, integrate your WhatsApp data with other business tools such as inventory systems, billing platforms, and digital marketing tools. This integration provides additional context that enriches your analysis.
For example, correlating WhatsApp data with inventory information can reveal which products generate the most inquiries but fewer sales, suggesting opportunities to improve presentation or pricing. Integration with financial data can show the real impact of WhatsApp on your overall revenue.
Customer behavior analysis
Customer behavior analysis goes beyond basic metrics to understand patterns, preferences, and motivations that drive buying decisions. This deeper understanding enables more effective personalization and more precise sales strategies.
Communication patterns
Analyze when your customers are most active on WhatsApp to optimize the timing of your communications. Identify days of the week and times that generate the most engagement, and adjust your communication strategy accordingly.
It also examines which types of content generate the best response: text messages, images, videos, or documents. This information helps you optimize your content mix to maximize engagement and conversion.
Also track the frequency of communication preferred by different customer segments. Some prefer frequent and detailed communication, while others respond better to occasional and concise messages.
Customer journey analysis
Map the entire customer journey from first contact to purchase and beyond. Identify at what points customers typically abandon the process and what factors contribute to successful conversions.
Use this information to optimize each stage of the process, eliminating friction that causes abandonment and reinforcing elements that facilitate conversion. It also identifies opportunities to add value at each touchpoint.
Behavioral segmentation
Use behavioral data to create more accurate and effective customer segments. Group customers based on buying patterns, communication preferences, price sensitivity, and other relevant behavioral factors.
These behavioral segments are often more predictive than traditional demographic segmentation, allowing for more effective personalization and better marketing results.
Data-driven optimization
The true value of analytics is realized when you use insights to continuously optimize your sales strategy. Data-driven optimization ensures that your decisions are based on real evidence rather than assumptions.
Systematic A/B testing
Implement regular A/B testing to optimize key elements of your strategy: welcome messages, follow-up techniques, closing offers, communication timing, and content types. Test only one element at a time to isolate the impact of each change.
Establishes clear criteria for evaluating test results, including minimum sample size, test duration, and success metrics. Document results to create a knowledge base to inform future decisions.
Process optimization
Use data to identify bottlenecks in your sales process and develop specific solutions. If you notice that many customers drop out after receiving pricing information, you may need to do a better job of building value before revealing costs.
Also optimize resource allocation based on performance data. Focus more time and effort on customer segments that generate better ROI, while automating or simplifying processes for lower value segments.
Forecasting and planning
Use historical data to identify trends and patterns to help you predict future behavior. This information is valuable for inventory planning, staffing, and marketing campaigns.
It also uses predictive analytics to identify customers at risk of churn and implement proactive retention strategies before churn materializes.
Intelligent automation with Aurora Inbox
Aurora Inbox uses machine learning to automatically analyze your data and provide specific recommendations for optimization. The system can identify patterns that would not be evident in manual analysis and suggest concrete actions to improve performance.
The platform can also automate many optimizations based on real-time data, adjusting communication strategies, message timing, and content sharing to maximize results with each individual customer.
With predictive analytics capabilities, Aurora Inbox can anticipate customer needs, identify cross-selling opportunities, and optimize the customer journey for each specific segment, resulting in continuous and sustainable improvements in sales performance.
Optimize your business today!
Find out how Aurora Inbox's AI agent for WhatsApp can revolutionize your customer service. Schedule a meeting to meet with him and take your service to the next level.
We are here to help you grow!